Asad ul islam
Equity & Investment analyst
Amarstock.com
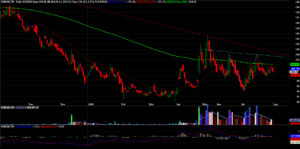
Bsrm Limited (BSRR @ Investing .com) formed a Head and Shoulders Bottom with a slightly downward sloped neckline marked in teal.
Major points to note:
- Prior Trend: Preceding Trend must be down to be a reversal H&S pattern , BSRR Started its down trend from price 136 tk since 9/10/2017 to its low of 90.4 tk on 8/1/2018.
- Volume change are on par with the price change, On the left shoulder we see BSRR makes a low of 99.3 tk and volume decrease slightly from average volume traded. Also while making a lower low and our patterns “HEAD” at 95 tk volume again goes down. Volume again goes down when BSRR makes the right shoulder at 99.7 tk. In almost perfect symmetry with its left shoulder. Meanwhile volume goes up and average volume traded each time price tries to go up.
- The dramatic decline to make the “head” or the lower low is controlled by less volume traded.
- After reaching the 2nd high of 108 tk we can draw the 2nd point of the neckline .
- BSRR is now waiting to break from the neck line around 107 tk. Any Inv Head & Shoulder is not complete till the neck line is broken and with good volume. Price may retrace to test the neckline and than move forward.
- We can estimate the initial price target by adding the neckline width to the “heads” bottom in case of BSRR it is 13.5 tk so adding this with neckline break price target of 107 tk We get 120.5 tk . Which is currently about 20% from todays closing price. Also we should take other factors such as previous resistance, moving average and fibo levels into consideration.

I would summarize me and my goals very simply “equity trading” . I have been an active trader in the equity market since the year 2006 and has been working full time as an analyst at amarstock ltd since inception after getting my Msc in accounting degree from Minnesota State University. Although amarstock is a startup me and my team love it as only passion and dreams should be loved. One thing i miss in dhaka stock exchange is the lack of short side play. I wish to trade in a market where shorting is an option. …Looking forward to get my CFA & CMT exams done with.